


July 4, 2026 · 15 min read
The Design Industry Is a Media System
AI-generated tables of Estonian and Finnish design companies reveal not one design market, but an ecology shaped by directories, activity codes, procurement, software, symbolic capital, and invisible labour.
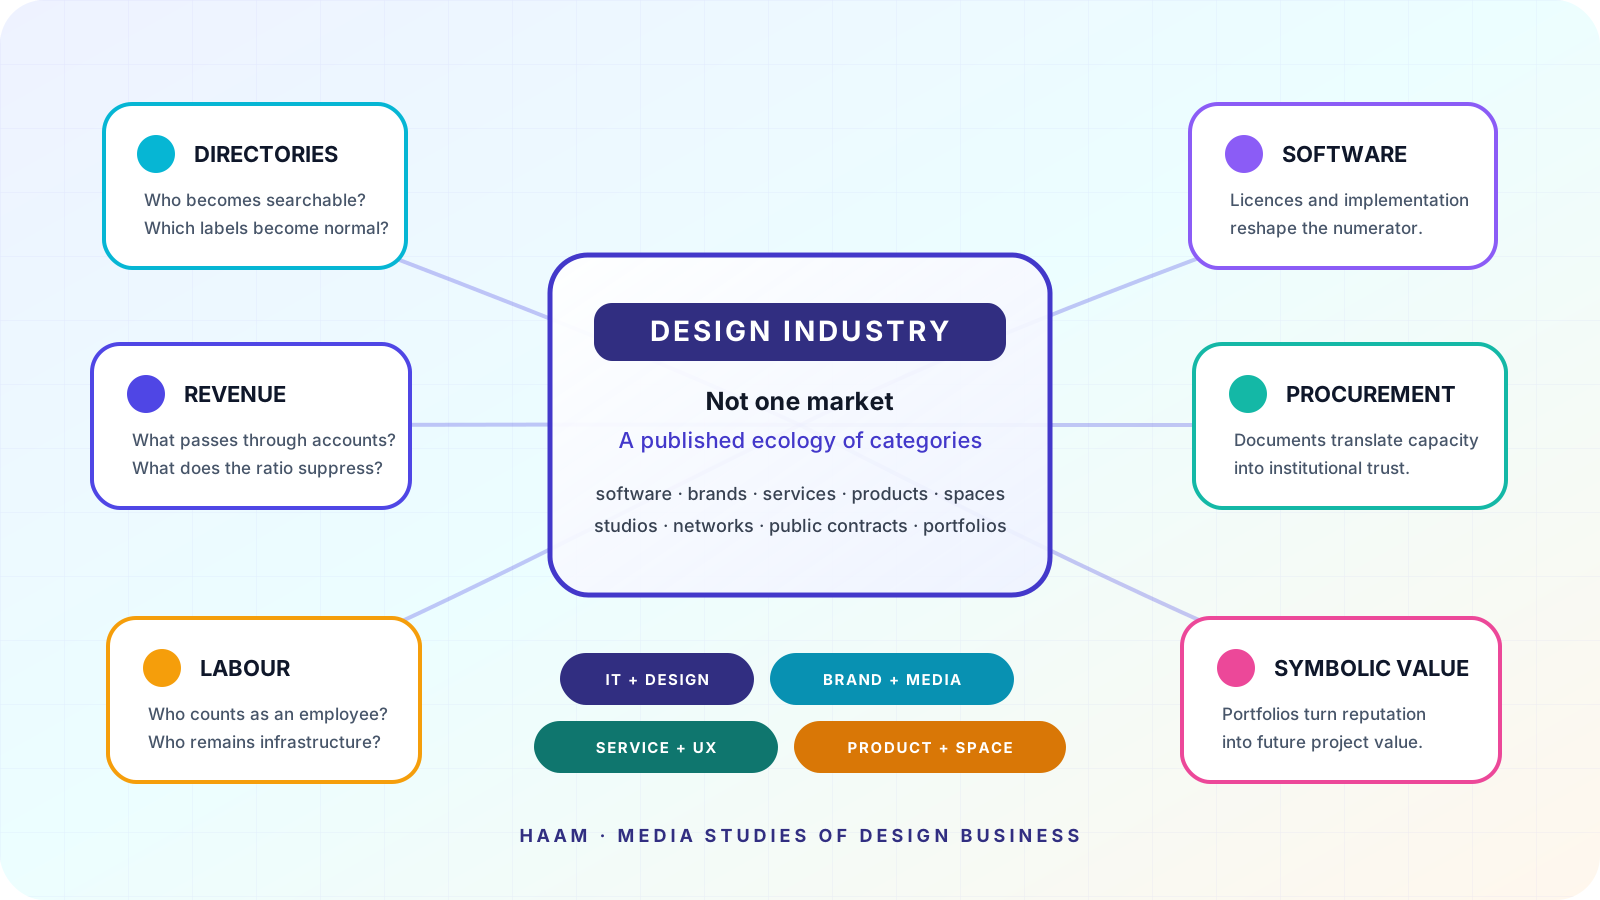
Table of contents
Media studies lens
The industry is an image of itself
A design industry does not appear automatically. It has to be represented. Directories decide who is searchable. Activity codes decide which firms become statistical design companies. Awards decide which work becomes culturally memorable. Portfolios turn projects into narratives. Financial databases translate messy organisations into rows that appear comparable.
Media studies asks us to look at these forms as active institutions. A table is not a transparent window onto the market. It is an interface that selects, orders, ranks, and removes context. The category design is therefore produced through repeated acts of publication.
The tables below are useful precisely because they are incomplete. They make the category's seams visible. A software integrator, a branding studio, an industrial designer, an interior architecture practice, and a one-person consultancy can all appear under the same label while converting labour into revenue through radically different systems.
Estonia and Finland at a glance
These are curated agency samples, not national censuses. Estonia starts from the Estonian Design Centre directory. Finland combines Design Forum Finland's directory with additional prominent independent studios. Within this sample, Finland's median revenue per employee is about 45% higher, but the two lists do not have identical selection rules.
Estonia sample
36 firms
30 have a meaningful employee denominator.
Estonia median
€76,750
Revenue per reported employee.
Finland sample
21 firms
17 have a meaningful employee denominator.
Finland median
€111,111
Revenue per reported employee.
Interpretive cluster map
Six different economies live inside the label design
IT and design hybrids
Trinidad Wiseman, Bitweb, Mobi Lab, Loihde Factor, Hion Digital
These firms sell design inside a larger technical delivery system. Software development, integration, maintenance, licences, and long contracts enlarge the revenue numerator. They can look like exceptionally productive design studios while operating with a different economic engine.
Brand and communication studios
Refleks, AKU, AD Angels, BOND, Werklig, Kokoro & Moi
Their product is partly symbolic: identity, distinction, narrative, recognition, and cultural position. Revenue depends on the studio's ability to turn reputation into project value. The portfolio is not only evidence of work. It is the medium through which future work becomes possible.
Service and UX consultancies
Hellon, DUX, Futurist, UX Estonia, Alpha Design Partners
These agencies make processes, interfaces, journeys, and organisations legible. Their output can be difficult to photograph, so workshops, frameworks, case studies, and client language become representational technologies that make invisible design work sellable.
Product and industrial design
Pentagon Design, Edea, Ten Twelve, iseasi, Omuus
The studio sits between concepts and manufacturing systems. Prototypes, materials, engineering partners, tooling, and production knowledge shape the business. The firm's visible headcount may represent only one node in a larger network of makers and specialists.
Spatial and environmental design
Fyra, Rune & Berg, Ruum 414, Kärt Maran
Spatial work is tied to property cycles, construction budgets, public environments, and specialist subcontractors. The agency's revenue tells only part of the story because a designed space emerges through a temporary coalition of architects, engineers, builders, fabricators, and clients.
Multidisciplinary design networks
Velvet, Aivan, Kuudes
These firms hold several design languages under one brand. Their advantage is translation across identity, products, services, space, and digital touchpoints. Their challenge is that the public category design becomes broad enough to hide which capabilities actually create margin.
AI-generated company table
Estonia
2024 revenue divided by the reported average employee count. Cluster labels are HAAM's interpretive classification, not official industry codes.
Showing 36 of 36 companies.
| Company | Cluster | Revenue | Employees | Revenue / employee | Data |
|---|---|---|---|---|---|
| Trinidad Wiseman | IT and design hybrid | €20,089,852 | 102 | €196,959 | Public source |
| Valge Creative | Brand and communication | €121,730 | 1 | €121,730 | Public source |
| Putka | Brand and communication | €115,306 | 1 | €115,306 | Public source |
| häk agency | Brand and communication | €912,964 | 8 | €114,121 | Public source |
| Meelis Mikker / Louki | Brand and communication | €109,492 | 1 | €109,492 | Public source |
| Refleks | Brand and communication | €1,515,535 | 14 | €108,253 | Public source |
| Kiri & Pilt | Brand and communication | €106,655 | 1 | €106,655 | Public source |
| Brand New | Brand and communication | €317,944 | 3 | €105,981 | Public source |
| AD Angels | Brand and communication | €841,449 | 8 | €105,181 | Public source |
| KOOR | Brand and communication | €732,796 | 8 | €91,600 | Public source |
| Velvet | Multidisciplinary design | €1,564,784 | 18 | €86,932 | Public source |
| Ten Twelve | Product and industrial | €843,101 | 10 | €84,310 | Public source |
| Dint | Brand and communication | €164,782 | 2 | €82,391 | Public source |
| Bitweb | IT and design hybrid | €2,860,386 | 35 | €81,725 | Public source |
| Unt/Tammik | Brand and communication | €242,742 | 3 | €80,914 | Public source |
| NOPE Creative | IT and design hybrid | €435,519 | 6 | €72,587 | Public source |
| DUX | Service and UX | €429,846 | 6 | €71,641 | Public source |
| Ruum 414 | Spatial and environment | €141,674 | 2 | €70,837 | Public source |
| JCO Design Factory | Brand and communication | €68,881 | 1 | €68,881 | Public source |
| AKU | Brand and communication | €351,227 | 6 | €58,538 | Public source |
| Mobi Lab | IT and design hybrid | €927,740 | 16 | €57,984 | Public source |
| Futurist | Service and UX | €114,272 | 2 | €57,136 | Public source |
| Tuumik Stuudio | Brand and communication | €114,090 | 2 | €57,045 | Public source |
| iseasi | Product and industrial | €258,416 | 5 | €51,683 | Public source |
| Sviiter | Brand and communication | €49,819 | 1 | €49,819 | Public source |
| disegno | Brand and communication | €42,239 | 1 | €42,239 | Public source |
| UX Estonia | Service and UX | €125,043 | 3 | €41,681 | Public source |
| Polaar | Brand and communication | €79,432 | 2 | €39,716 | Public source |
| Redwall | Brand and communication | €259,014 | 7 | €37,002 | Public source |
| Kärt Maran / Tohuto | Spatial and environment | €19,142 | 1 | €19,142 | Public source |
| HI advisory | Service and UX | €123,982 | 0 reported | Not meaningful | Public source |
| Made by Man | Brand and communication | €105,406 | 0 reported | Not meaningful | Public source |
| Meliorad | Service and UX | €13,030 | 0 reported | Not meaningful | Public source |
| Orgcaos | Service and UX | €3,690 | 0 reported | Not meaningful | Public source |
| Tüpokompanii | Brand and communication | €19,665 | 0 reported | Not meaningful | Public source |
| Upstairs Studio | Product and industrial | €42,594 | 0 reported | Not meaningful | Public source |
A zero or missing employee count makes revenue per employee undefined. Founder labour, board-member work, freelancers, subcontractors, licences, and pass-through costs can all sit outside the reported employee number.
AI-generated company table
Finland
2024 revenue divided by the reported average employee count. Cluster labels are HAAM's interpretive classification, not official industry codes.
Showing 21 of 21 companies.
| Company | Cluster | Revenue | Employees | Revenue / employee | Data |
|---|---|---|---|---|---|
| Pentagon Design | Product and industrial | €3,945,000 | 25 | €157,800 | Public source |
| Loihde Factor | IT and design hybrid | €15,156,000 | 103 | €147,146 | Public source |
| Hellon | Service and UX | €4,385,000 | 30 | €146,167 | Public source |
| Kokoro & Moi | Brand and communication | €134,000 | 1 | €134,000 | Public source |
| BOND Creative Agency | Brand and communication | €3,110,000 | 24 | €129,583 | Public source |
| Adventure Club | IT and design hybrid | €4,475,000 | 36 | €124,306 | Public source |
| Alpha Design Partners | Service and UX | €496,000 | 4 | €124,000 | Public source |
| Nordkapp | IT and design hybrid | €2,215,000 | 18 | €123,056 | Public source |
| Kuudes | Multidisciplinary design | ≈ €2,000,000 | 18 | ≈ €111,111 | Public source |
| Aivan | Multidisciplinary design | €8,434,000 | 83 | €101,614 | Public source |
| Fyra | Spatial and environment | ≈ €2,300,000 | 23 | ≈ €100,000 | Public source |
| Hion Digital / Frantic | IT and design hybrid | €5,790,000 | 59 | €98,136 | Public source |
| Avaava | Service and UX | €480,000 | 5 | €96,000 | Public source |
| Rune & Berg Design | Spatial and environment | €1,820,000 | 20 | €91,000 | Public source |
| Edea Design | Product and industrial | €1,072,000 | 13 | €82,462 | Public source |
| Arctic Factory | Service and UX | €332,300 | 5 | €66,460 | Public source |
| Design Reform | Product and industrial | €119,000 | 3 | €39,667 | Public source |
| Co-Founders | Brand and communication | €411,000 | 0 reported | Not meaningful | Public source |
| Fjord / Accenture Song | IT and design hybrid | Not separated | Not reported | Not meaningful | Public source |
| Omuus | Product and industrial | ≈ €178,000 | Not reported | Not meaningful | Public source |
| Werklig | Brand and communication | €1,501,000 | Not reported | Not meaningful | Public source |
A zero or missing employee count makes revenue per employee undefined. Founder labour, board-member work, freelancers, subcontractors, licences, and pass-through costs can all sit outside the reported employee number.
Revenue per employee is a medium, not a verdict
Revenue per employee compresses a firm into one ratio. Like every medium, it amplifies some qualities and suppresses others. It rewards companies that pass software licences, subcontracted work, or large implementation budgets through their accounts. It can make a founder-led studio look hyper-efficient when the founder is not counted as an employee.
The ratio says nothing directly about profit, wages, creative quality, working conditions, client concentration, social value, or environmental cost. A company can have high revenue per employee and weak margins. Another can deliberately maintain lower utilisation because it invests in research, culture, or long-term capability.
The number becomes most useful when read relationally. Compare firms with similar delivery systems. Ask what passes through the revenue line. Ask who is missing from the employee count. Ask whether the agency sells hours, outcomes, licences, construction packages, intellectual property, or access to a trusted reputation.
Directories edit the market
The Estonian Design Centre directory lets users filter by design type, location, and company size. Design Forum Finland organises agencies through areas such as brand, business design, circular design, service design, industrial design, UI, and UX. These taxonomies do more than help clients search. They teach the market what kinds of design are available.
Inclusion creates visibility, while absence can make an active firm statistically and culturally disappear. Meanwhile, firms such as Trinidad Wiseman or Loihde Factor can enter the design field through UX and service design even though much of their turnover comes from wider digital delivery. The directory expands design's territory, but it also makes direct financial comparison unstable.
Procurement manufactures scale
Large public and enterprise contracts favour organisations that can prove capacity, security, continuity, certifications, and prior delivery. This creates a feedback loop. Winning a large framework agreement produces references and revenue, which improve the ability to qualify for the next agreement.
The result is not merely that some firms are better at design. Some firms have become media-compatible with procurement. They can translate their capabilities into the documents, categories, risk language, and organisational form that institutional buyers recognise.
Small studios often work inside the same projects as specialists or subcontractors, but the prime contractor receives the visible revenue and the public case study. Scale is therefore partly an outcome of how credit, risk, and authorship are distributed.
The labour hidden by the table
A company can report zero employees and still produce substantial work. The missing labour may belong to founders paid through dividends, board members, freelancers, partner studios, production vendors, or companies elsewhere in a group. The table records a legal and accounting boundary, not the full social organisation of creation.
This matters because creative industries frequently convert networks into the appearance of a compact studio. The portfolio presents coherent authorship, while the project may have depended on a temporary constellation of researchers, writers, illustrators, developers, fabricators, photographers, and client-side teams.
Media studies gives us a useful question: who becomes visible as the author, and who remains infrastructure? Revenue per employee should be read alongside the politics of credit.
Methodology and limits
The Estonian sample follows the companies listed in the Estonian Design Centre's designer directory. The Finnish sample begins with Design Forum Finland's agency directory and adds prominent independent Finnish studios to make the comparison more representative of the market discussed here.
Revenue per employee is calculated as 2024 revenue divided by the reported average employee count for the same reporting period. Approximate figures are marked. Rows with zero or unavailable employees remain visible, but no ratio is calculated. Fjord is part of Accenture, so a separate Finnish agency figure is not available.
The source link in each row points to the public company-data page used for that figure. Commercial databases may update or restate values. Legal entities, brands, groups, and agency names do not always align. This page is a research interface, not a credit report.